×
The Principles of Supply and Demand and How They Apply to Residential Property
We Only Send You Awesome Stuff
We Only Send You Awesome Stuff
January 15, 2019
|
LocationScore

Happy New Year! All of us at LocationScore wishes you a great year ahead. And well, with 2018 just gone, it was certainly an interesting year. Let's see how the first month of 2019 has done.
December 14, 2018
|
LocationScore
Summer is here!! And what a way to kick start the season with some media coverage from OECD and ABC 7:30 Report on House of Cards. :)
October 17, 2018
|
LocationScore
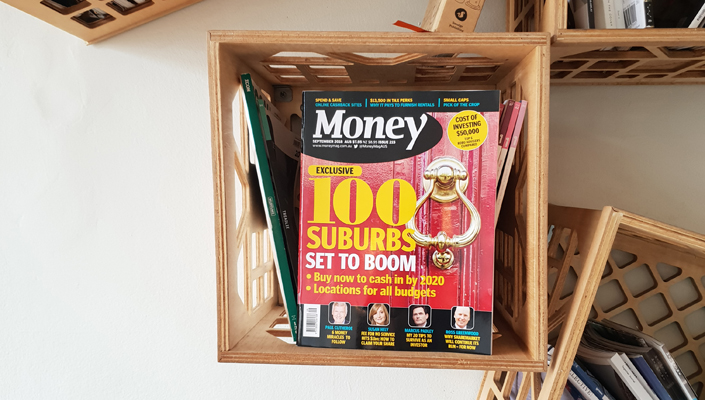
Featured as the cover story of Money Magazine, our LocationScore Lads talk about the top 100 suburbs set to boom in Australia!
October 9, 2018
|
LocationScore
The LocationScore Lads appeared on The Property Couch, Episode 193 to talk about this month's SUA Tracker Report!

September 25, 2018
|
LocationScore
This time on Qantas Travel Insider Magazine, Jeremy was asked to pinpoint a few of the suburbs that will grow in the coming years and why!
September 20, 2018
|
LocationScore
There cannot be a better time to release our Top 50 SUA Tracker Report for September 2018! With all the doom and gloom going floating around the media recently, how has our top 50 Significant Urban Areas performed?

August 13, 2018
|
LocationScore
And it's that time of the month for our monthly SUA Tracker and we've got a few interesting trends this month!
August 7, 2018
|
LocationScore
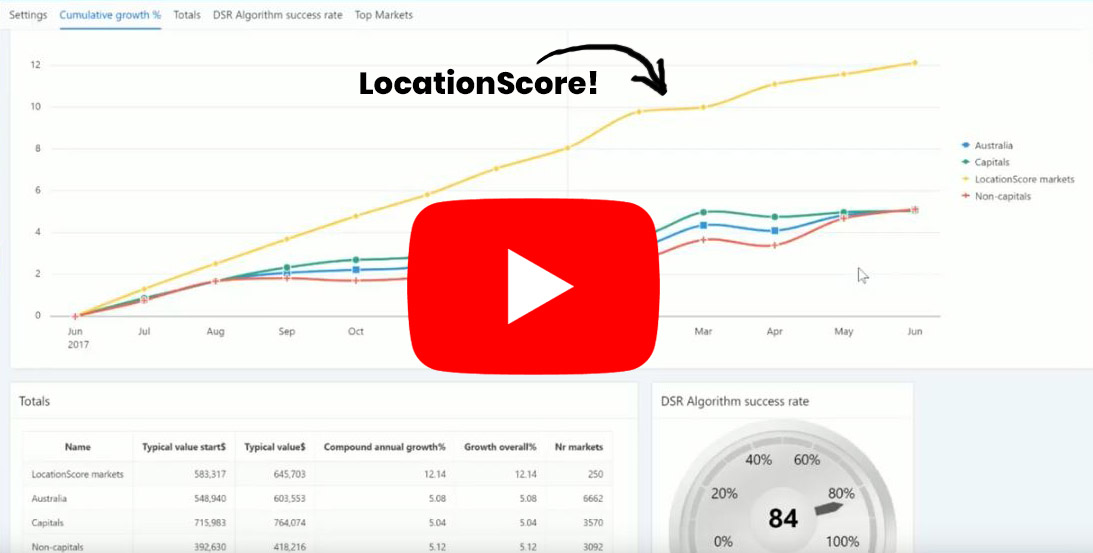
We accept that past performance is no guarantee of future performance — but we are super confident that LocationScore is incredible value for money, because its algorithm and big data analysis is based on the proven economic principle of demand vs. supply. The greater the demand the higher the probability of price growth, as clearly demonstrated in the results shown.
July 10, 2018
|
LocationScore
Just right after the end of the Financial Year, will there be any changes in the Property Market? Check out our SUA Tracker July 2018 to find out more!
June 15, 2018
|
LocationScore
Our third issue, the June 2018 Report for the Top 50 Significant Urban Area in Australia is now out!

I have procrastinated over my next investment purchase for some time and having access to LocationScore has given me confidence in my chosen suburb and I have just signed the contract today.

The use of LocationScore has added another tool to the property search tool belt. It has become an essential part of the trade taking plenty of time out to the research process by providing valid, accurate and up to date information to assist in making informed decisions. It is the first port of call when researching an area and takes the leg work out of the research process.

Love the website. It's quick and easy to use and navigate. When researching a property, rather than manually search each individual detail about a suburb, LocationScore wraps it all together on one page which allows you to decide whether to investigate the suburb further or move onto the next. Look forward to more valuable information to come.

Location Score is the cure for paralysis by analysis! It allows me to refine my shortlist of suburbs and focus more time on the suburbs with the best growth potential. Thank-you Location Lads for bringing a sophisticated yet affordable tool to the market.
Most Popular Blog Posts


