×
The Principles of Supply and Demand and How They Apply to Residential Property
We Only Send You Awesome Stuff
We Only Send You Awesome Stuff

LocationScore
|
June 15, 2018
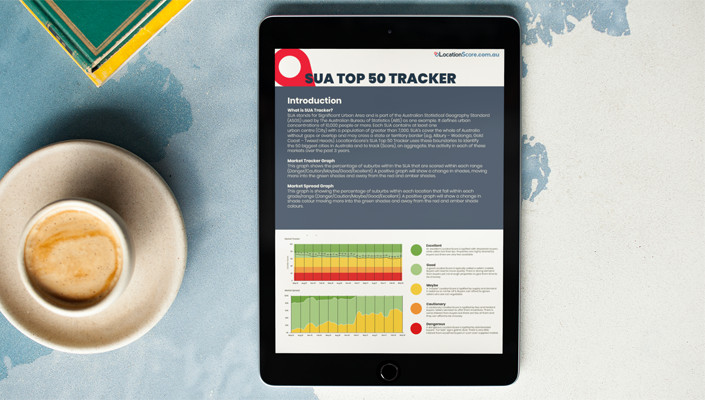
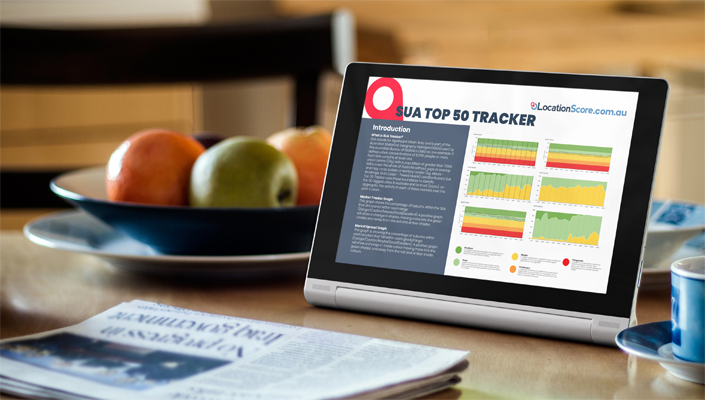
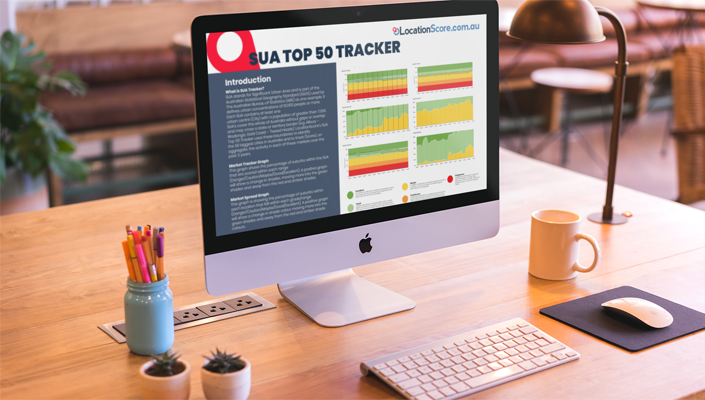
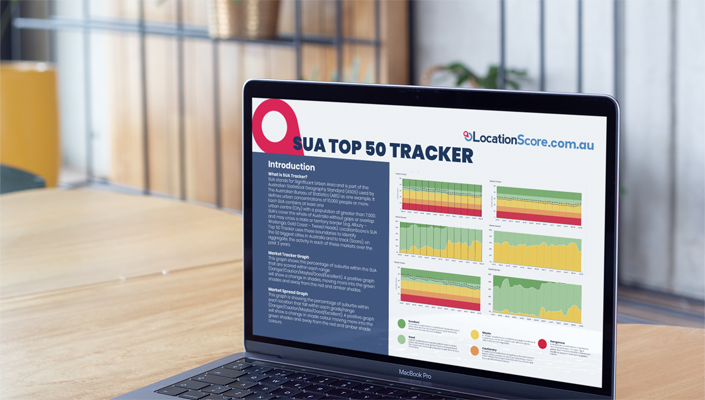
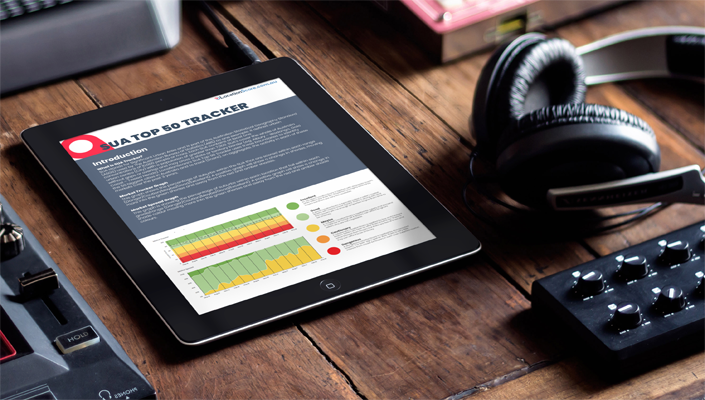
And our June 2018 SUA Tracker Report is out!
Data shows that Sydney’s cooling is still progressing slowly indicating a strong demand in certain areas. As mentioned in last month's SUA Tracker, there’s not enough in the figures to suggest prices should drop much further. ......

This article is exclusively for our paid subscribers only. If you are currently a subscriber of LocationScore, simply click here to sign in and continue reading this post.
If you’re interested in becoming a member, why not subscribe to LocationScore today? You get access to not only all these blog posts but more importantly, Suburb Analyser reports on each suburb across Australia and the Top 250 Reports as well.
Just select your preferred plan below or click here to learn more about the subscription.
P.S.: Still Unsure About LocationScore? Put us to the test! Subscribe to our website for up to 24 hours, risk-free. If for any reason you are not completely satisfied, we will provide a full refund. No questions asked. No hassle.

Suburb Analyser Search & Reporting - Houses
15,000 suburbs Analysed for House (monthly)
Top 250 Fast Track Filter – National
Suburb Analyser Search & Reporting - Units
15,000 suburbs Analysed for Units (monthly)
Top 250 Fast Track Filter – By State or Territory
Top 250 Fast Track Filter – By Capital Cities

I have procrastinated over my next investment purchase for some time and having access to LocationScore has given me confidence in my chosen suburb and I have just signed the contract today.

The use of LocationScore has added another tool to the property search tool belt. It has become an essential part of the trade taking plenty of time out to the research process by providing valid, accurate and up to date information to assist in making informed decisions. It is the first port of call when researching an area and takes the leg work out of the research process.

Love the website. It's quick and easy to use and navigate. When researching a property, rather than manually search each individual detail about a suburb, LocationScore wraps it all together on one page which allows you to decide whether to investigate the suburb further or move onto the next. Look forward to more valuable information to come.

Location Score is the cure for paralysis by analysis! It allows me to refine my shortlist of suburbs and focus more time on the suburbs with the best growth potential. Thank-you Location Lads for bringing a sophisticated yet affordable tool to the market.
Most Popular Blog Posts