How It Works

LocationScore analysis is based on one of the fundamental laws of economics, the law of supply and demand. If demand outweighs supply, then prices will rise. But if supply outweighs demand, prices will fall.

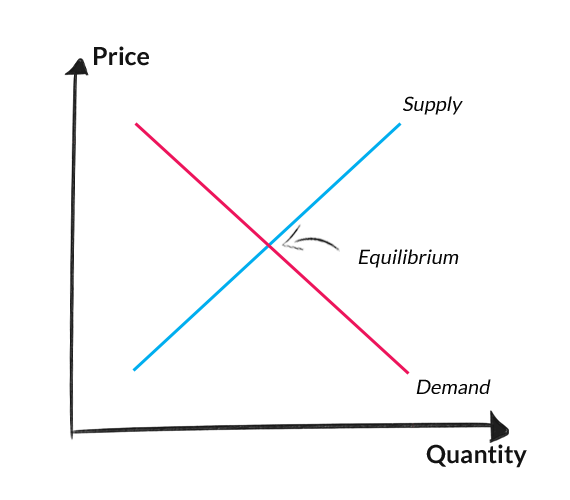
Property prices tend to rise when demand exceeds supply.

There is not enough 'good pie' to go around, so people start to pay a premium for that delicious 'beachside' pie. Generally speaking in an economy there are many macro measures all designed to get a 'read' on the performance of the economy. The same can be said for property too, there are countless variables influencing demand and supply: from the arrival of new stock, local economic fluctuations, new infrastructure, interstate and overseas migration all needing somwhere to live etc. Through LocationScore's own research we have identified 8 indicators that when combined

show a strong relationship to price growth when the LocationScore is higher than average.

These 8 Indicators Include:

The average count of days a property remains for sale in a particular market (Days on Market)

The current percentage of vacant properties for rent (Vacancy rate)

The average discount of original asking prices to the eventual sale prices (Vendor Discount)

The rental income as a percentage of property value (Rental Yield)

The percentage of auctioned properties that sell during the auction (Auction Clearance Rates)

The percentage of all properties in a market that are currently advertised for sale (Percentage of Stock on the Market)

The number of owner-occupiers vs. renters (Percentages of Renters to Owner-Occupiers)

The number of online searches for property compared to the number of properties for sale or for rent in a suburb (Online Search Interest)

As our name suggests, LocationScore analyses these 8 key indicators through its advanced algorithm to produce an indicative score for each location. This score helps you better identify the suburbs and property types showing strong demand and restricted supply, which puts upward pressure on prices for property in these locations.

It's true that a lot of this data can be found online or through other sources; but the enormous task of collecting it every month for over 15,000+ suburbs across Australia for both houses and units and then processing it in a meaningful way, is more than enough for many to put it in the too-hard basket.

To further compound the challenge, our own analysis revealed that when you just look at one or two indicators on their own, the results are significantly lower in terms of selecting the right suburb for price growth.

This can happen because in some cases, one month in isolation might give you a great score for one or two indicators, but the next month you get a really poor score.

A good example of this might be an Auction Clearance Rate of 50% in one particular month, and then the next month it is 100%. But in the first month, 16 properties were auctioned, and the next month only two properties were. So in this case, two problems are visible.

Simply relying on one or two indicators is not enough because it doesn't tell a reliable story. Statistics can be unreliable, particularly with volatile indicators, which bounce around from time to time. That's why LocationScore maximises the statistical reliability of combining all 8 key statistics together for a superior level of insight into the level of demand and supply within each suburban marketplace.

Key Benefits LocationScore

Capital growth drivers that really work

Research faster and more effectively

Intelligent interpretation of big data

Easy to use and simple to understand

Objective algorithm, free of any bias

Consistent method used to score each market

Help you build your property investment dreams

Numerically compare suburb against suburb

Save countless hours by not researching property in the wrong location

Avoid a very costly mistake if you buy in the wrong location

Want the LocationScore Advantage?


BEST VALUE

$147

QUARTERLY

(SAVING $514 or 84%)

GET INSTANT ACCESS
$97

MONTHLY

(SAVING $137 or 67%)

GET INSTANT ACCESS

WHATS INCLUDED?

Suburb Analyser Search & Reporting - Houses

15,000 suburbs Analysed for House (monthly)

Top 250 Fast Track Filter - National

Suburb Analyser Search & Reporting - Units

15,000 suburbs Analysed for Units (monthly)

Top 250 Fast Track Filter - By State or Territory

Top 250 Fast Track Filter - By Capital Cities